Lab 4 - Ohm's Law
Objectives:
- Measure and plot the current-voltage relationship for a resistor.
- Construct a graph of the data from objective 1.
- Given a graph of current-voltage for a resistor, determine the resistance.
Reading:
Floyd, Principles of Electric Circuits, Sections 3-1 through 3-5.
Materials Needed:
Resistors:
One 1.0KΩ, one 1.5KΩ, and one 2.2KΩTest Equipment:
One DC Ammeter, 0-19mASummary Of Theory:
The flow of electrical charge in a circuit is called current. Current is measured in units of Amperes, or amps for short. The ampere is defined as one coulomb of charge moving past a point in one second. Current is abbreviated with the letter I (for Intensity) and is frequently shown with an arrow to indicate the direction of flow. Conventional current is defined as the direction a positive charge would move under the influence of an electric field. When electrons move, the direction is opposite to the direction defined for conventional current. To clarify the difference. The term electron flow is frequently applied to current in the opposite direction of conventional current.
The relationship between current and voltage specifies the characteristics of an electrical device. One convenient way to represent these quantities is with a graph. In order to construct the graph, one of the variables is changed and the response of the other variable is observed. The variable that was initially moved is called the independent variable; the one that responds is called the dependent variable. By convention, the independent variable is plotted along the x-axis (the horizontal axis) and the dependent variable is plotted along the y-axis (the vertical axis). In this experiment, the voltage will be controlled (independent) and the current will respond (dependent).
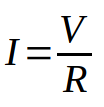
Fixed resistors have a straight-line, or linear, current-voltage curve. This linear relationship illustrates the basic relationship of Ohm’s Law – namely, that the current is proportional to the voltage for constant resistance. Ohm’s law is the most important law of electronics. It is written in equation form as
Ohm's Law Equation
where I represents current, V represents voltage, and R represents resistance.
Procedure:
- Measure three resistors with listed values of 1.0kΩ, 1.5kΩ, and 2.2kΩ. Record the measured values in Table 4-1.
- Connect R1 into the circuit shown in figure 4-1.

Figure 4-1
- Adjust the power supply for a voltage of 2.0V. Measure the current that is through the resistor and record it in Table 4-2.
- Adjust the power supply for 4.0V and measure the current. Record the current in Table 4-2. Continue taking current readings for each of the voltages listed in Table 4-2.
- Replace R1 with R2 and repeat steps 3 and 4. Record the data in Table 4-3.
- Replace R2 with R3 and repeat steps 3 and 4. Record the data in Table 4-4.
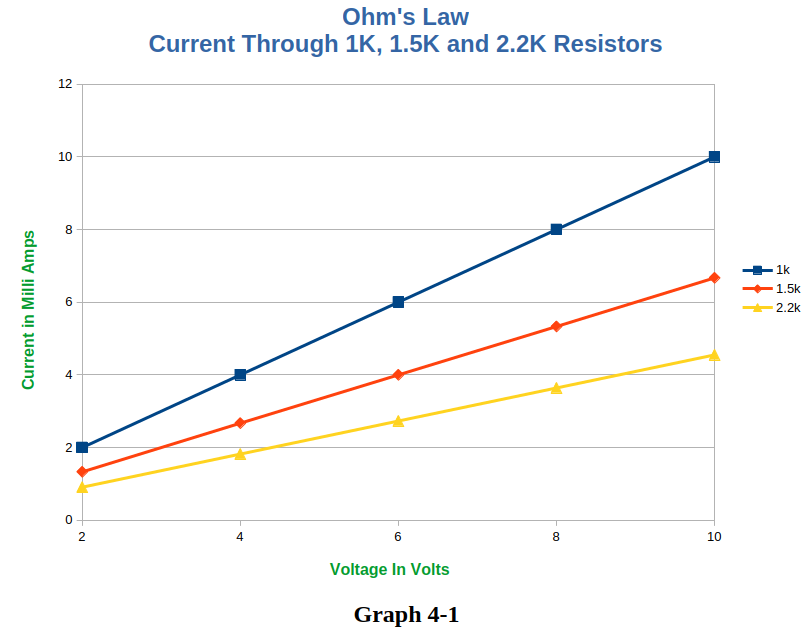
- On plot 4-1, graph all three I-V curves using the data from Tables 4-2, 4-3, and 4-4. Plot the dependent variable (current) on the y-axis and the independent variable (voltage) on the x-axis. Choose a scale for the graph that spreads the data over the entire grid. Label the three resistance curves with the resistor values.
For Futher Investigation:
Not all devices have a linear current-voltage relationship. (This is what makes electronics interesting!) Investigate a zener diode I-V curve. The circuit is shown in Figure 4-2. The 1.0kΩ resistor is used to limit the total current in the circuit. Notice the polarity of the zener diode. Measure the voltage across the zener diode as the power supply is varied and enter the measured zener voltage in Table 4-5. The circuit is a series circuit so the zener current is the same as the current read by the ammeter. Summarize your results with a graph of the zener current as a function of the zener voltage.
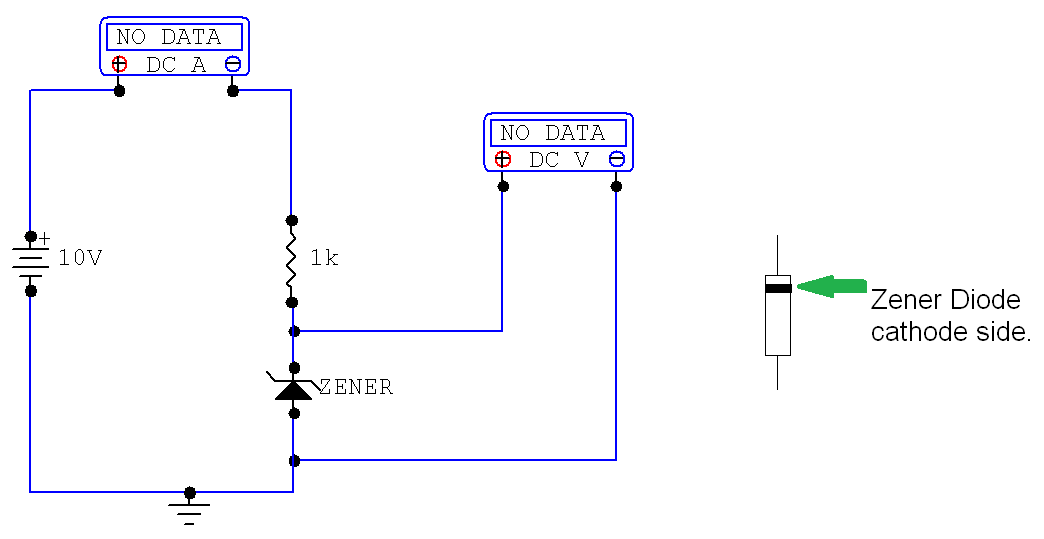
Figure 4-2
Application Problem:
A student decides to set up switches for testing the resistors in this experiment. The student has only two double-pole, single-throw switches. A partial schematic is drawn in Figure 4-3 of the report. The two switches are to be wired in a way that connects only one resistor at a time to the voltage source. When S1 is in position B, only R1 is in the circuit; when S1 is moved to position A and S2 is in position C, only R3 will be in the circuit; when S2 is now moved to position D, only R2 is in the circuit. Complete the schematic shown in Figure 4-3.
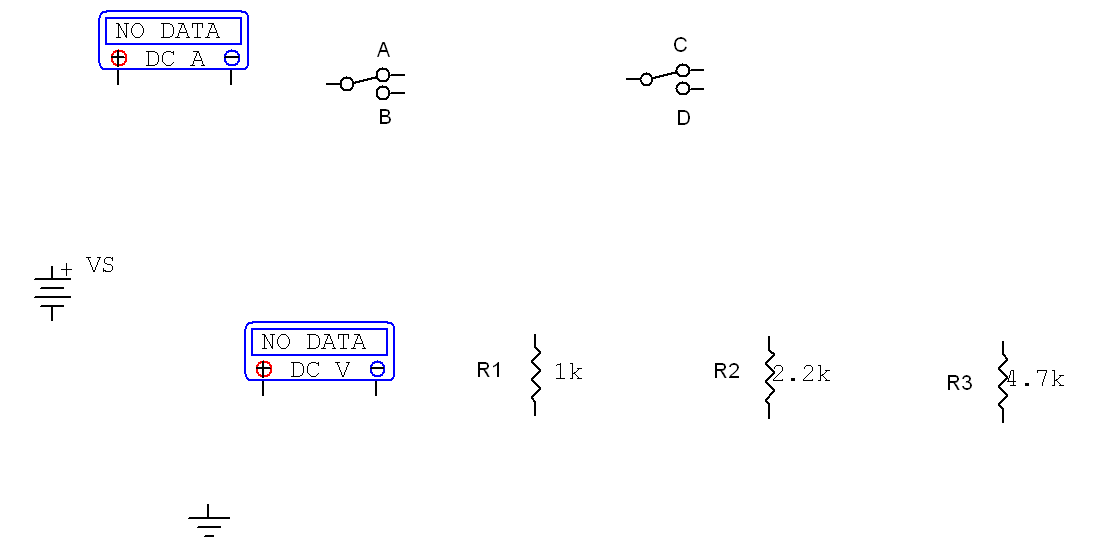
Figure 4-3
Report for Experiment 4 - Ohm's Law
Abstract:
The goal of this experiment is to ascertain the relationship between voltage and current in a series resistor circuit. The circuit in Figure 4-1 was built. A 1.0kΩ, a 1.5kΩ, and a 2.2kΩ resistor was placed in the circuit – one at a time. The voltage was increased from 2 Volts to 10 Volts – in 2 Volt increments. The voltage and current was measured at each step. Ohm's Law is stated as:

Where I is current, V is Voltage and R. is Resistance. Rearranging the equation to solve for Voltage or Resistance yields the following…

Data:
NOTE:
All the circuits were built and “tested” in a Schematc Capture software package called CircuitMaker version 5.04 from 1998. Therefore the “Measured” values are equal to the “Listed” or “Ideal” values of the components. Could I have used real components on a breadboard? Sure, but I’m lazy. I’ll probably breadboard the circuits – at some point. But whether using real or simulated components – the measurements and by extension – the calculations – are close enough. You’ll still get the same data points and the graphs or charts will still show the expected load line. On a side note – CircuitMaker no longer exists – they were bought out by Altium.


Results and Conclusions:
The objective for this portion of the lab was to measure, plot and graph the current-voltage relationship for a resistor. To that end – the circuit in figure 4-1 was built. Three different resistance values were chosen. Each resistor was connected to the circuit – one at a time. The voltage (the independent variable) was increased in 2 Volt increments – starting at 2 Volts and ending at 10 Volts. At each the step – the current (the dependant variable) was measured. Ohm’s Law states that for a constant value of resistance – the current is proportional to the voltage. The data in tables 4-2 through 4-4 and graph 4-1 clearly show this to be true. As the voltage across the resistor increased – the current through the resistor also increased. As the resistance values increased – the overall current through the resistor decreased but the relationship between voltage and current remained the same. The data and the graph show the the current-voltage relationship in a purely resistive circuit is linear.
Further Investigation Results:
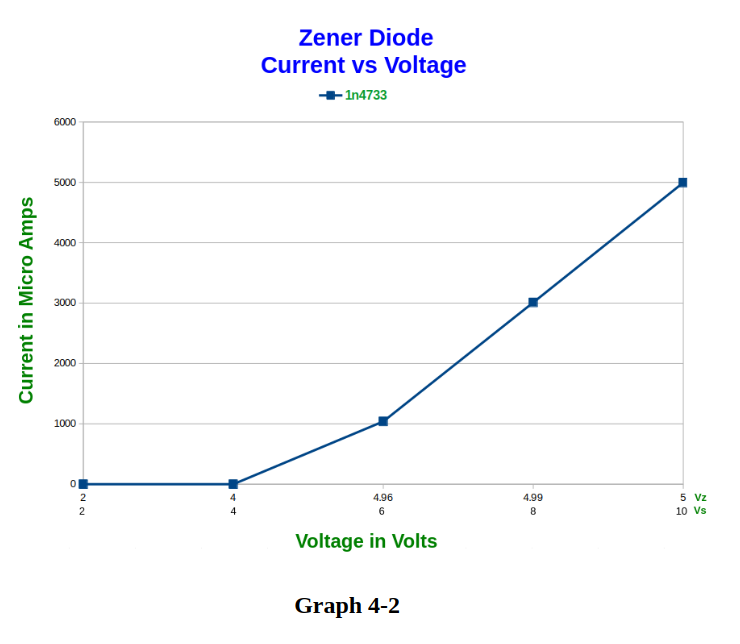
In this portion of the lab – the objective was to find the current-voltage relationship of a Zener diode. Diodes can be said to “clamp” voltage at a particular value regardless of how much current is passing through them. Note that this is true so long as the diode is kept within its voltage and current design specifications. Typical Silicon and Germanium diodes have a voltage drop of around 0.7 Volts and 0.3 Volts, respectively. Zener diodes are designed for a variety of different voltages. In this instance a 5 Volt Zener diode was chosen and the circuit in figure 4-2 was built. As before – the voltage was increased in 2 Volt increments from 2 Volts to 10 Volts. The data in table 4-5 was obtained and plotted in graph 4-2. Graph 4-2 shows that the voltage across the Zener diode is not linear but rather a curve. Graph 4-2 also shows Vs (Voltage Source) and Vz (the Voltage across the Zener diode). As long as Vs is below 5 Volts – the current through the diode is virtually non-existant – the diode is essentially “off”. Once Vs reaches 5 Volts and above – the diode gets turned “on” and current starts to flow. The graph shows that as Vs continues to increase – Vz remains relatively constant at 5 Volts.
Application Problem Results:
Figure 4-4 shows the completed circuit from the schematic shown in figure 4-3 – where Switch 1 is connected to side B – so that only R1 (the 1K resistor) is in the circuit.
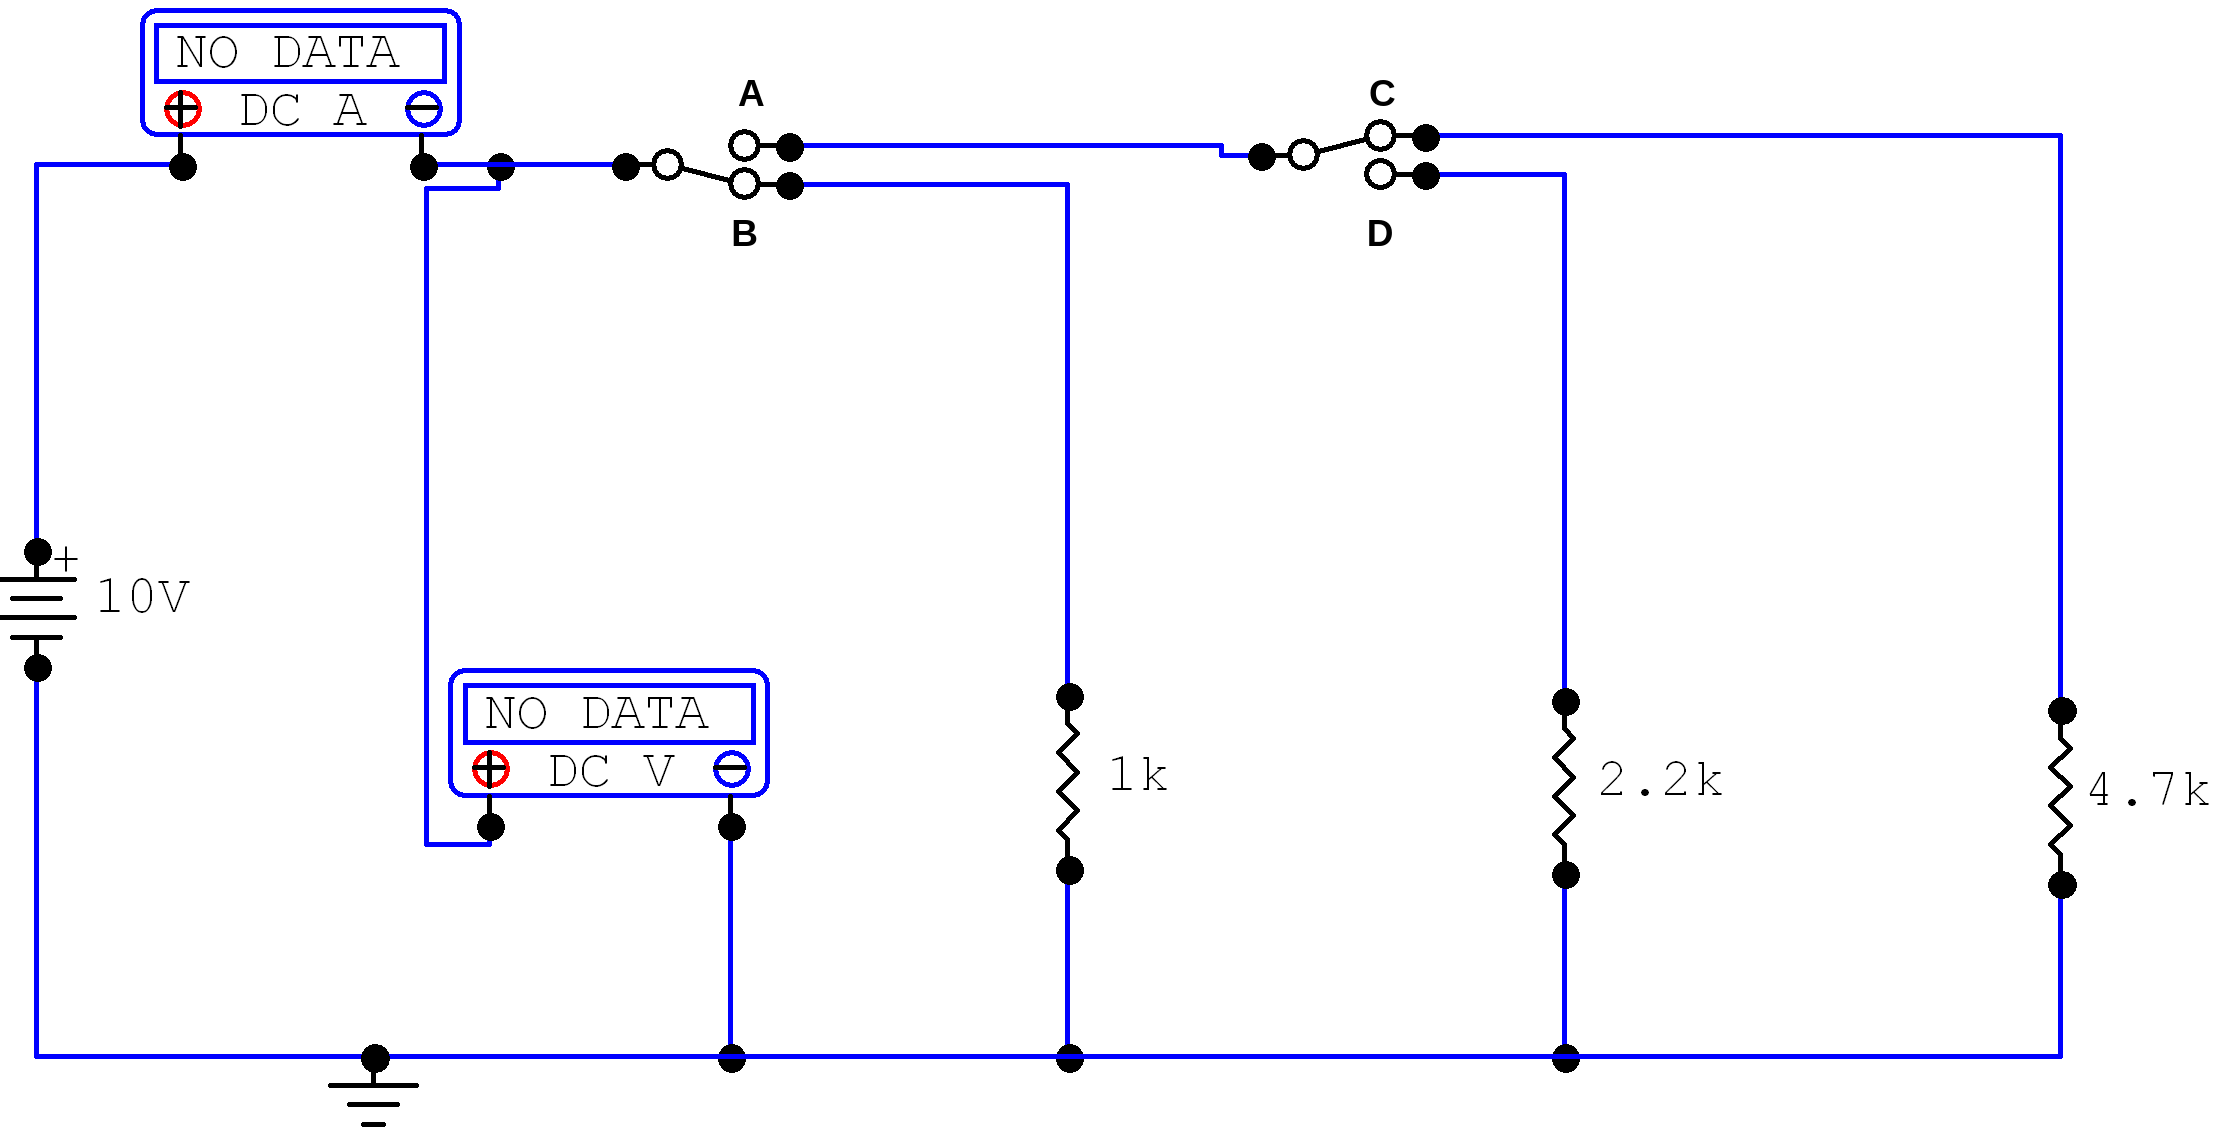
Figure 4-4
Figure 4-5 shows the completed circuit from the schematic shown in figure 4-3 – where Switch 1 is connected to side A and switch 2 is connected to side C – so that only R3 (the 4.7K resistor) is in the circuit.
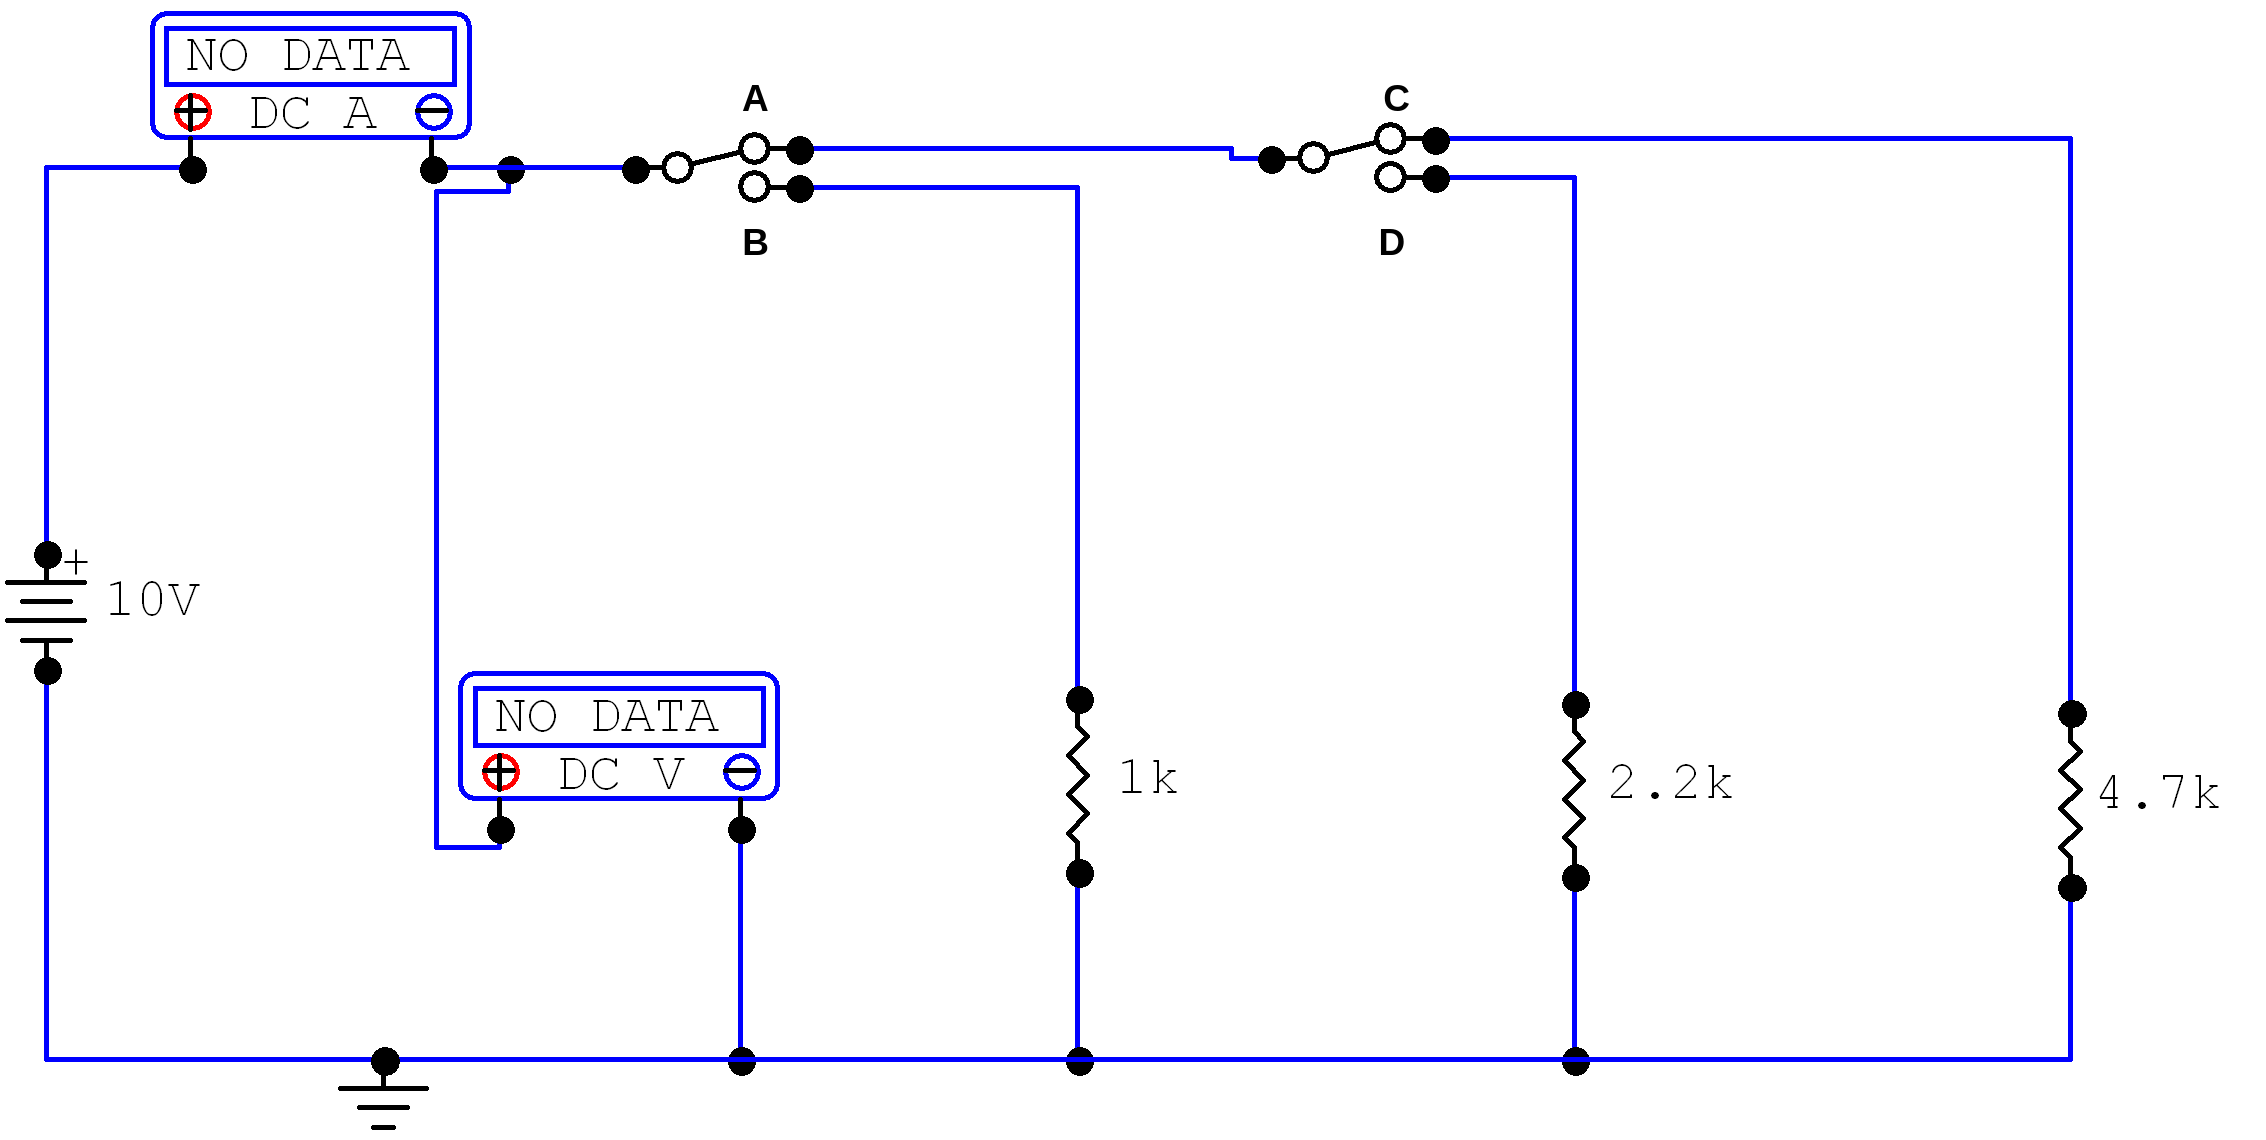
Figure 4-5
Figure 4-6 shows the completed circuit from the schematic shown in figure 4-3 – where Switch 1 is connected to side A and switch 2 is connected to side D – so that only R2 (the 2.2K resistor) is in the circuit.
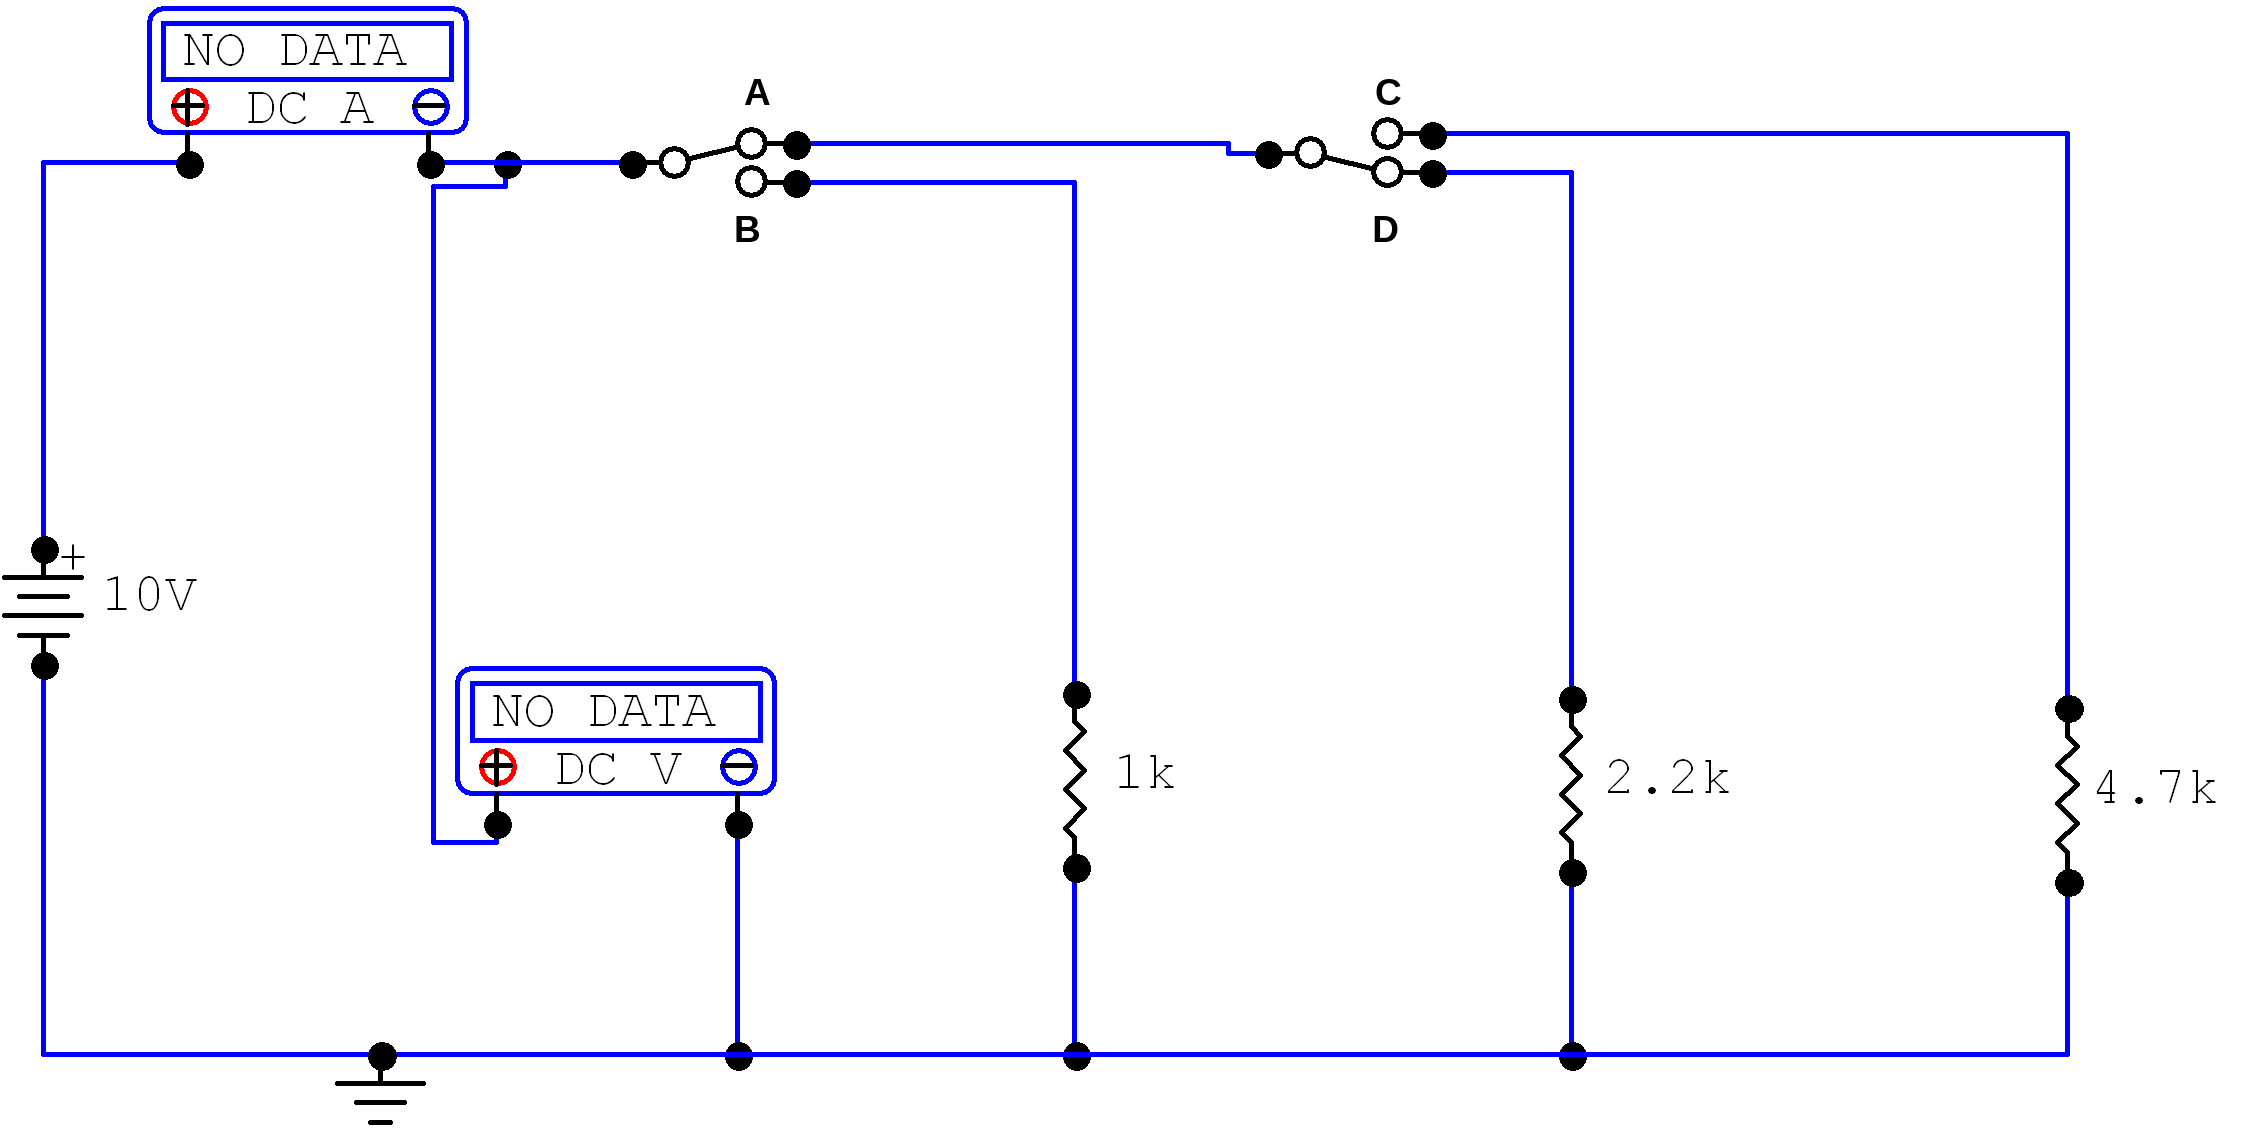
Figure 4-6
Evaluation And Review Questions:
- The slope of a line is the change in the y direction divided by the change in the x direction. The definition of slope is illustrated in figure 4-7. Find the slope for each resistor on Graph 4-1. Note that the slope for a resistor has units for conductance, the siemens.
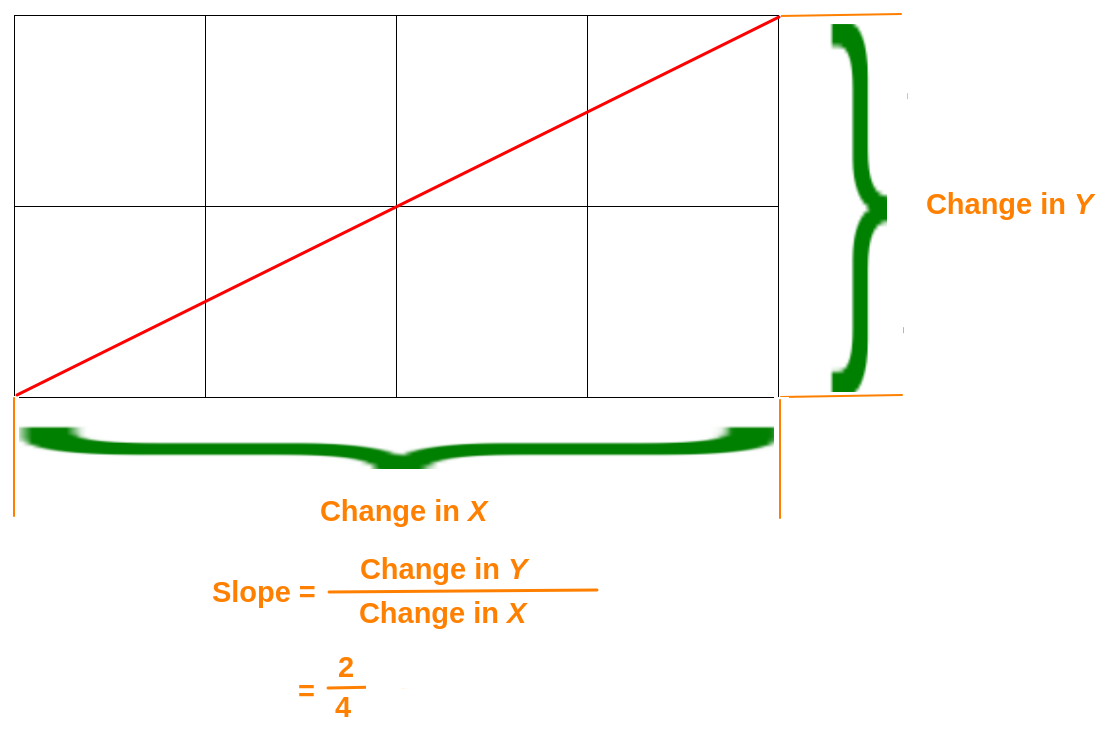
Figure 4-7


NOTE:
Even though the slope of a resistor has a value of Siemans – in math – the slope of a line doesn’t have a value perse – it’s simply a ratio. It measures the steepness (angle) and direction (up [positive] or down [negative]) of a line.
- What happens to the slope of the I – V curve for larger resistors?
As resistor values increase the slope of the line decreases. Per Ohm’s Law – as resistance goes up – current goes down. So, the value of Y in the equation for slope – gets smaller. - If the resistance is halved and the voltage is not changed, what will happen to the current in a resistive circuit? The current will go up. Again – Ohm’s Law – less resistance – equals more current.
- If the voltage is doubled and the resistance is not changed, what will happen to the current in a resistive circuit? The current will go up. Once again – Ohm’s Law - current is proportional to voltage.
-
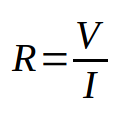
If the current in a resistive circuit is 24ma and the applied voltage is 48V, what is the
resistance?

-
What current is in a 10Ω resistor with a 5.0V applied?


- The resistance of a tungsten bulb increases as it gets hotter. How does this help explain why many bulbs burn out when they are first turned on? Since the resistance increases as the bulb gets hotter – it means the resistance is low when the bulb is cold. In many instances – it may be too low to handle the sudden surge of input current – when the switch is turned on. So you end up with POP – Smoke Test!
